This is a summary of links featured on Quantocracy on Monday, 05/02/2016. To see our most recent links, visit the Quant Mashup. Read on readers!
- No new links posted.
Quant Blog Mashup
This is a summary of links featured on Quantocracy on Monday, 05/02/2016. To see our most recent links, visit the Quant Mashup. Read on readers!
This is a summary of links featured on Quantocracy on Sunday, 05/01/2016. To see our most recent links, visit the Quant Mashup. Read on readers!
This is a summary of links featured on Quantocracy on Saturday, 04/30/2016. To see our most recent links, visit the Quant Mashup. Read on readers!
This is a summary of links featured on Quantocracy on Friday, 04/29/2016. To see our most recent links, visit the Quant Mashup. Read on readers!
This is a summary of links featured on Quantocracy on Thursday, 04/28/2016. To see our most recent links, visit the Quant Mashup. Read on readers!
This is a summary of links featured on Quantocracy on Wednesday, 04/27/2016. To see our most recent links, visit the Quant Mashup. Read on readers!
This is a summary of links featured on Quantocracy on Tuesday, 04/26/2016. To see our most recent links, visit the Quant Mashup. Read on readers!
This is a summary of links featured on Quantocracy on Monday, 04/25/2016. To see our most recent links, visit the Quant Mashup. Read on readers!
This is a summary of links featured on Quantocracy on Sunday, 04/24/2016. To see our most recent links, visit the Quant Mashup. Read on readers!
The best quant mashup links for the two weeks ending Saturday, 04/23 as voted by our readers:
We also welcome one blog making its first ever appearance on the mashup:
And finally, the latest from Quantocracy:
* * *
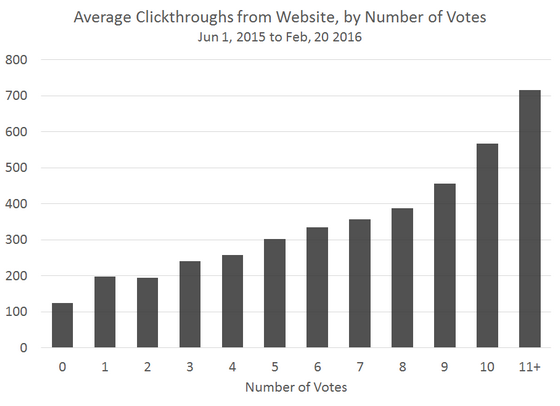
[click graph to enlarge]
The graph to the right shows the average number of clickthroughs a link receives from our website (excluding RSS, Twitter and Stocktwits), broken out by the number of votes cast by our readers.
A core goal of Quantocracy is to have a positive impact on our corner of the financial world by rewarding the best work, and encouraging the best minds to keep writing.
As the graph makes clear, the citizens of Quantocracy are doing just that (way to go guys). Links with 11 or more votes receive nearly 6-times as many clickthroughs as a link with no votes (wow).
If you haven’t done so already, we invite you to register to vote and be a part of the effort. Your votes matter to the quant community.
Read on Readers!
Mike @ Quantocracy